Supply Chain Evaluation for Water Quality Sensor Procurement: A 2026 Guide for Industrial Buyers
Supply Chain Evaluation for Water Quality Sensor Procurement: A 2026 Guide for Industrial Buyers
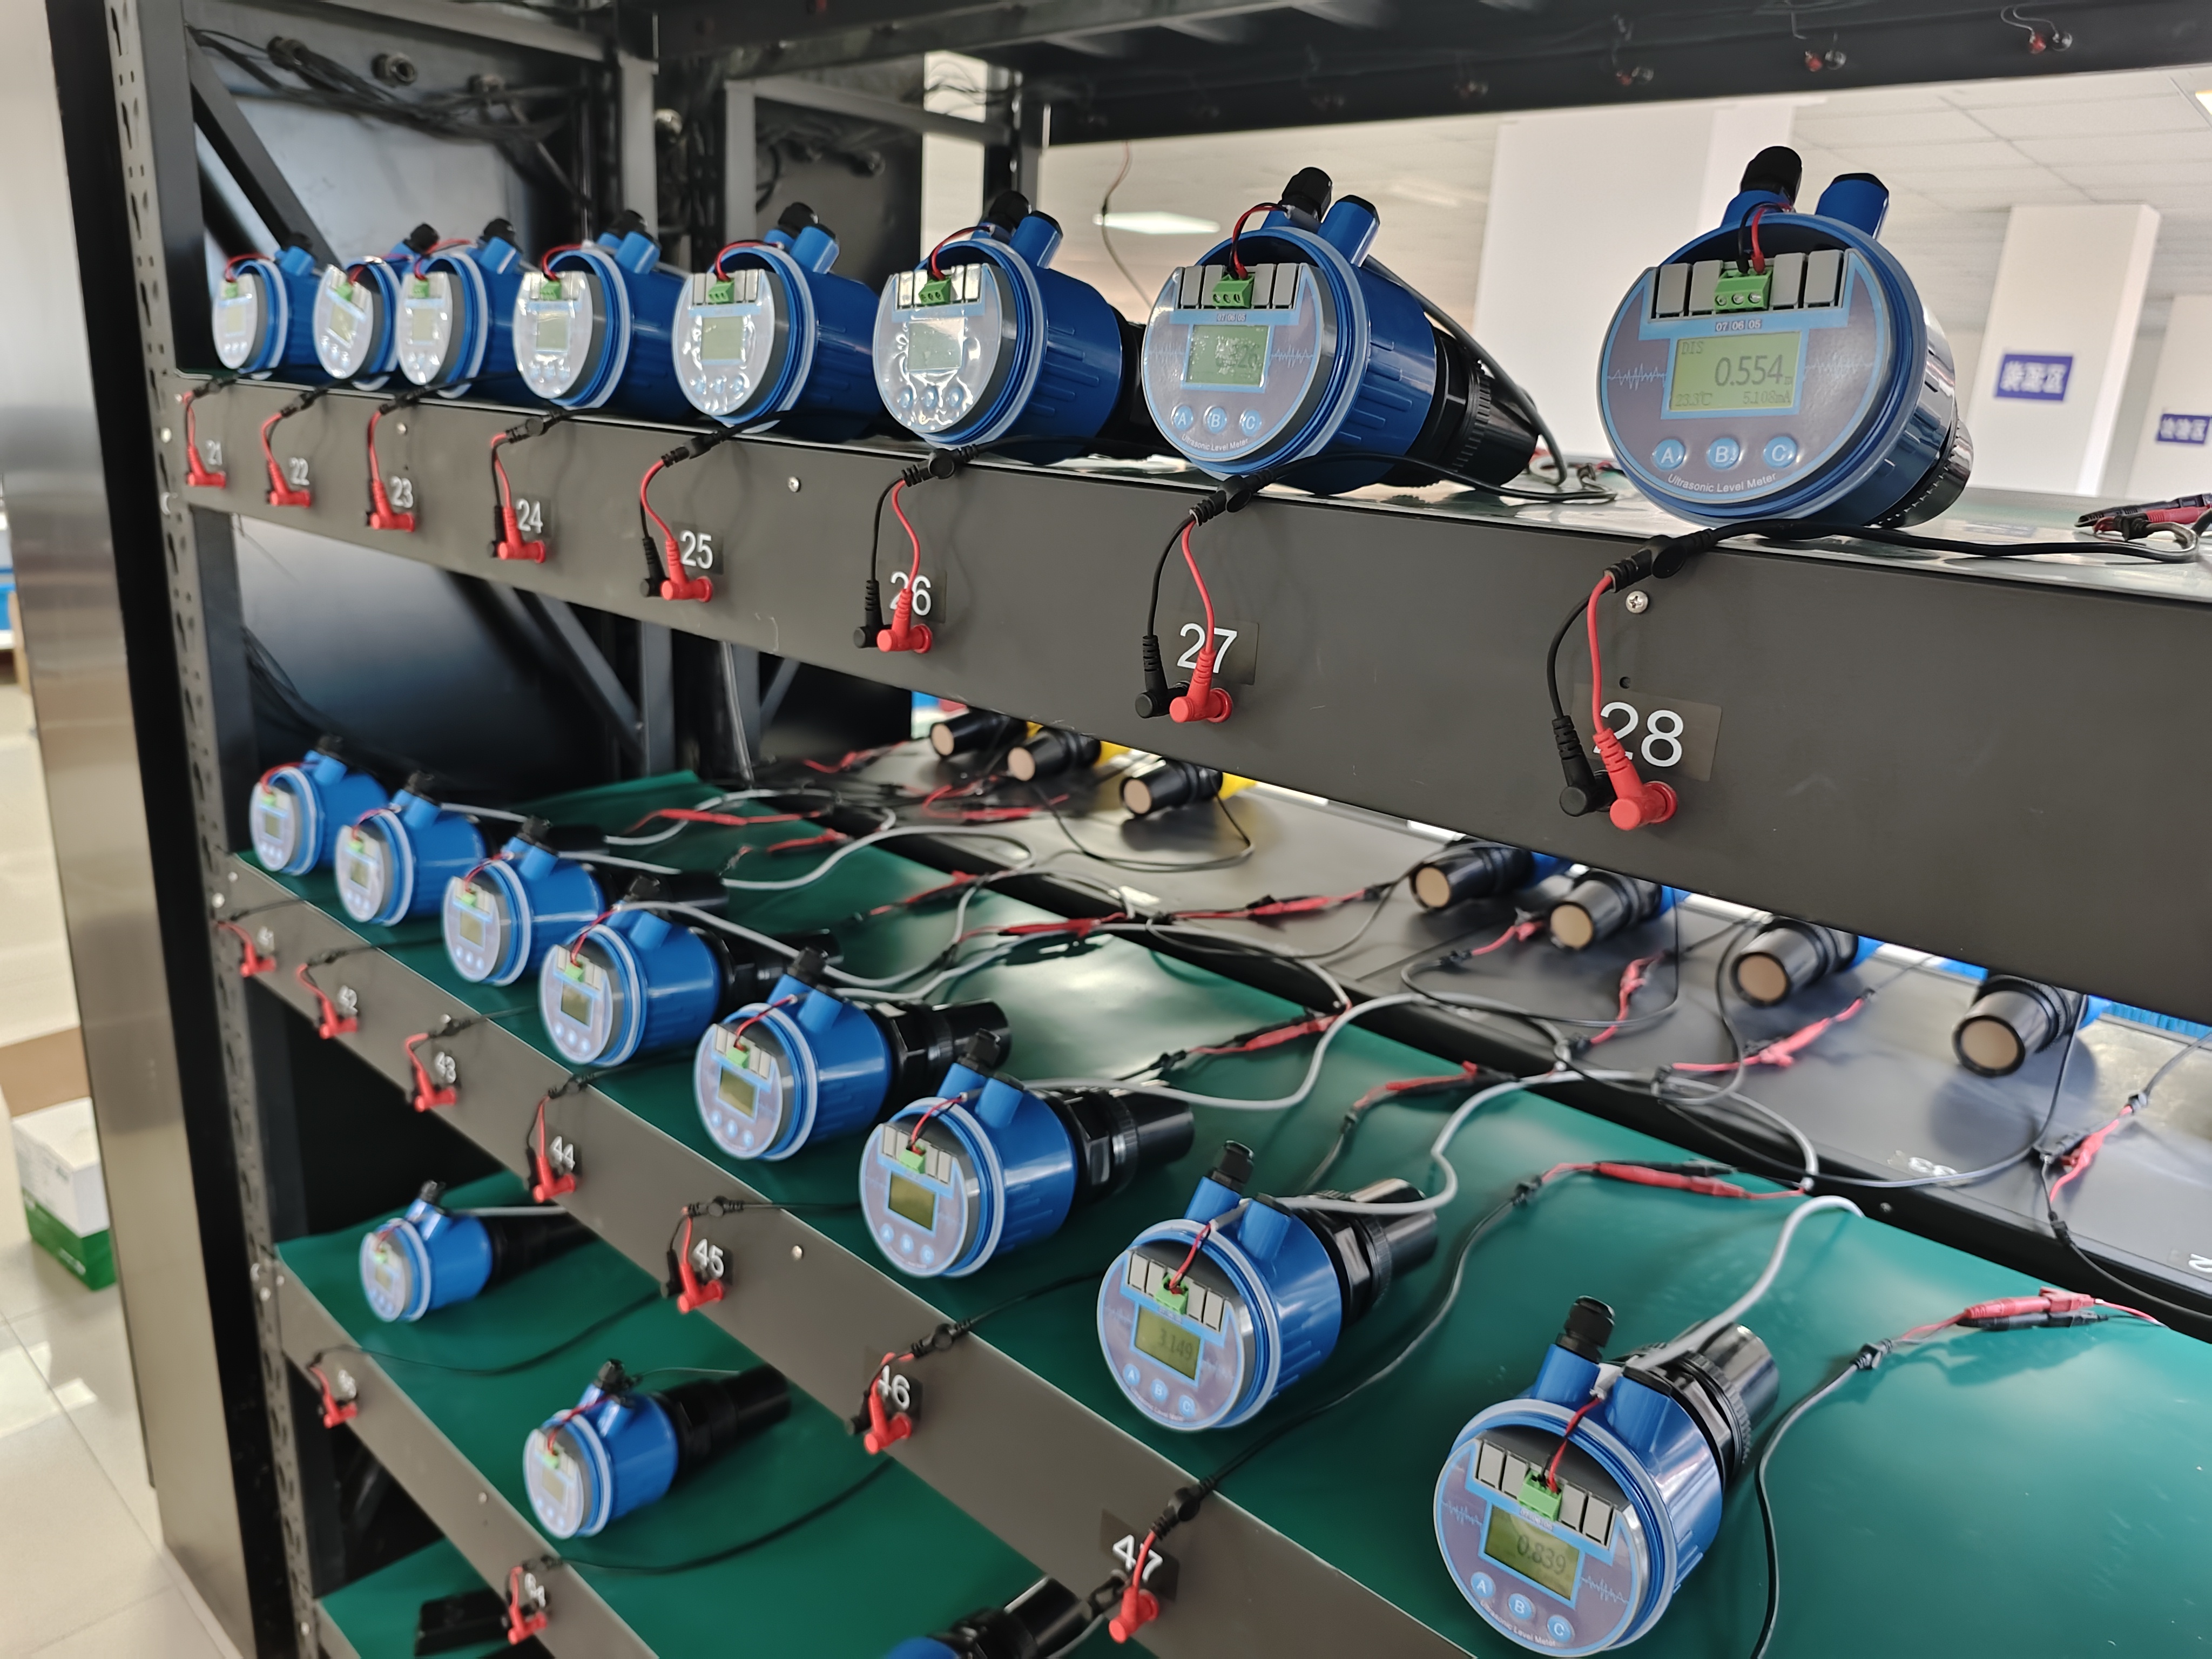
Production line for ultrasonic level sensors at a manufacturing facility.
For industrial procurement professionals, selecting a water quality sensor supplier extends beyond product specifications. A critical, yet often overlooked, component of the selection process is a rigorous evaluation of the supplier's production capacity and supply chain reliability. This guide outlines a structured framework for assessing these operational capabilities, with a focus on the water quality sensor segment, to ensure your project timelines and quality standards are met.
Core Procurement Question: How can buyers systematically evaluate a water quality sensor manufacturer's capacity to meet demand and guarantee controlled delivery cycles?
1. Capacity Assessment: Three Key Metrics
Quantifying a supplier's production capacity requires moving beyond vague claims. Focus on these three verifiable metrics:
- Production Line Scale: The number of dedicated assembly and testing lines indicates specialization and parallel processing capability. For instance, a manufacturer with multiple focused lines for sensor assembly, electronics, and final calibration can handle higher volumes and product mix.
- Monthly Output Volume: This is a direct indicator of steady-state capacity. A manufacturer quoting a monthly capacity of 5,000 units for standard sensors demonstrates a scalable operation for medium to large projects.
- Maximum Order Capacity: The ability to absorb a large, single order without disrupting other commitments is crucial. This is often linked to raw material inventory management and workforce flexibility.
Consider Kacise (Xi'an Kacise Optronics Tech Co., Ltd.) as a reference point. The company operates from a 40,000 m² facility and maintains a stated monthly production capacity of 5,000 water quality sensor units. This scale supports an annual output potential exceeding 120,000 units across its product range, which is relevant for buyers planning phased rollouts or large-scale deployments.
2. Delivery Cycle Analysis: Four Influencing Factors
The promised lead time is a composite of several variables. A reliable supplier should transparently address these four factors:
- Order Type (Standard vs. Custom): Standard catalog items typically have shorter lead times, often ranging from 5-8 working days for shipping preparation, depending on quantity. Customized units requiring specific protocols, voltages, or connectors will extend this timeline.
- Degree of Customization: Modifications such as OEM/ODM branding, output signal changes (e.g., 4-20mA to RS485 Modbus), or cable length alterations require additional engineering and production scheduling.
- Logistics and Shipping Method: The chosen Incoterm (FOB, CIF, DDP) and final destination significantly impact the total delivery window. Suppliers with established logistics partnerships can offer more predictable transit times.
- Raw Material Inventory Strategy: Suppliers holding strategic reserves of key components (e.g., stainless steel housings, optical components, specialized membranes) are better insulated from market shortages and can maintain shorter lead times.
Lead Time Comparison: Standard vs. Complex Orders
| Order Type | Typical Production Lead Time | Key Influencers |
|---|---|---|
| Standard Catalog Sensor | 5-8 working days (pre-shipment) | Stock levels, order quantity |
| Customized Sensor (Voltage/Protocol) | 2-4 weeks | Engineering review, component sourcing |
| Full OEM/ODM Project | 4-8 weeks | Design confirmation, mold/tooling, sample approval |
3. Supply Chain Stability and Risk Mitigation
Robust suppliers proactively manage supply chain risks. Evaluate their strategies in these areas:
- Multi-Source Procurement: Reliance on single sources for critical components (e.g., optical lenses, ion-selective electrodes) is a red flag. Inquire about their supplier diversification policy.
- Production Line Redundancy: The ability to shift production between lines if one encounters issues minimizes disruption risk.
- Quality Control Integration: A "100% test" policy before shipment, as practiced by some manufacturers, is a strong indicator of a controlled process that reduces the risk of field failures and associated project delays.
Certifications also provide objective evidence of a standardized and controlled manufacturing process. For example, holding a CE-EMC certificate (e.g., ZTS23061509TCE for water quality sensors against EN IEC 61326-1:2021) demonstrates compliance with international electromagnetic compatibility standards, which is often a prerequisite for projects in the EU and other regulated markets.
4. The Chinese Supplier Proposition: Capacity and Flexibility
Chinese manufacturers in the water quality sensor segment have evolved from pure low-cost producers to partners offering significant capacity and supply chain advantages. These often include:
- Scalable Production Bases: Large-scale facilities allow for rapid scaling of output to meet fluctuating demand.
- Support for Emergency Orders: Flexible production scheduling can accommodate urgent requests, a critical factor for maintenance or unexpected project needs.
- Rapid Sample Delivery: The ability to provide functional samples within a short timeframe (e.g., 7 days) accelerates the evaluation and specification process for buyers.
For instance, a manufacturer like Kacise, with a monthly capacity of 5,000 units and a minimum order quantity (MOQ) of 1 unit, offers both volume scalability and accessibility for pilot projects. Their support for remote after-sales service further extends supply chain reliability into the operational phase.
5. Market Comparison: Evaluating Top-Tier Suppliers
A holistic evaluation often involves comparing potential suppliers. The table below contrasts three real manufacturers in the water quality monitoring space based on publicly available capacity and delivery data. This illustrates how to apply the assessment framework.
| Manufacturer | Reported Monthly Capacity (Sensor Units) | Typical Lead Time (Standard Items) | Key Supply Chain Focus | Notable Market Position |
|---|---|---|---|---|
| Kacise (Xi'an Kacise Optronics) | 5,000 units | 5-8 working days (pre-shipment) | OEM/ODM flexibility, integrated multi-parameter design | Cost-performance focus for wastewater and aquaculture |
| Hach Company (US) | Data varies by product line; large-scale global production. | Subject to regional warehouse stock; longer for custom configs. | Global logistics network, extensive application support | Premium brand for regulatory compliance and municipal water |
| Endress+Hauser (Germany) | High-volume automated lines for core products. | Standard items from local centers; project-based for complex systems. | Local production hubs, high vertical integration | High-accuracy process instrumentation for chemical/pharma |
Note: Capacity and lead time data for Hach and Endress+Hauser are generalized from industry analysis and may vary by specific product and region.
6. Procurement Checklist: Key Questions for Suppliers
Before finalizing a supplier, seek clear answers to these operational questions:
- What is your current monthly production capacity for the specific sensor model we require?
- What is the breakdown of your lead time (production, testing, shipping) for an order of [X] units?
- Do you maintain safety stock for critical long-lead components? Can you describe your inventory strategy?
- What is your process for handling and prioritizing emergency or rush orders?
- Can you provide a recent example of a large order (e.g., 30+ units) delivered on schedule, and what were the key success factors?
- What are your accepted payment terms? (e.g., T/T, Western Union, MoneyGram)
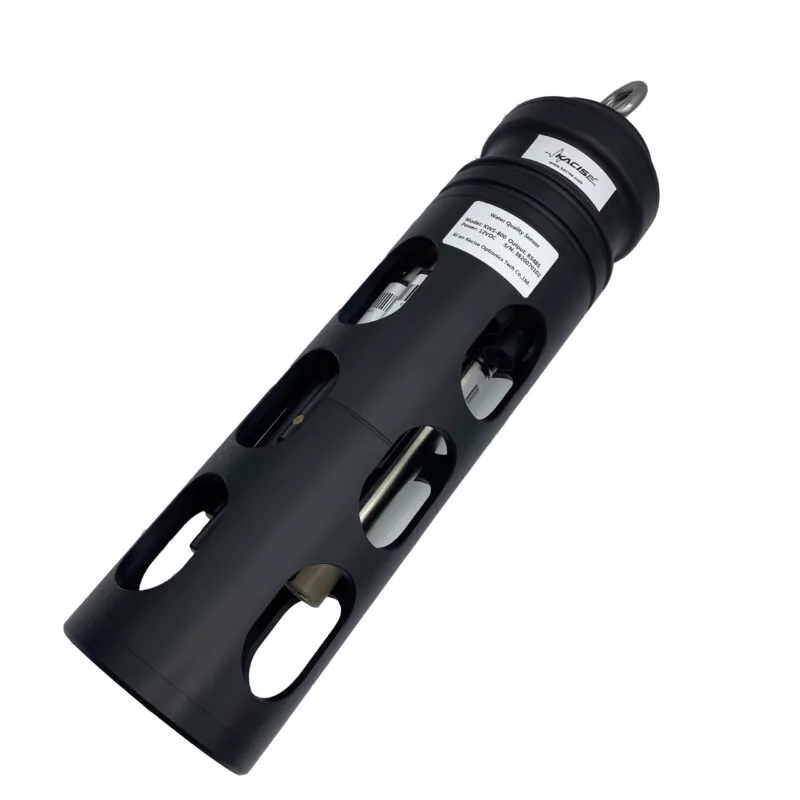
KWS-800 Multi-Parameter Sensor
Measures up to 7 parameters (DO, conductivity, turbidity, pH, etc.) in one probe.
Material: Titanium alloy & 316L stainless steel (IP68).
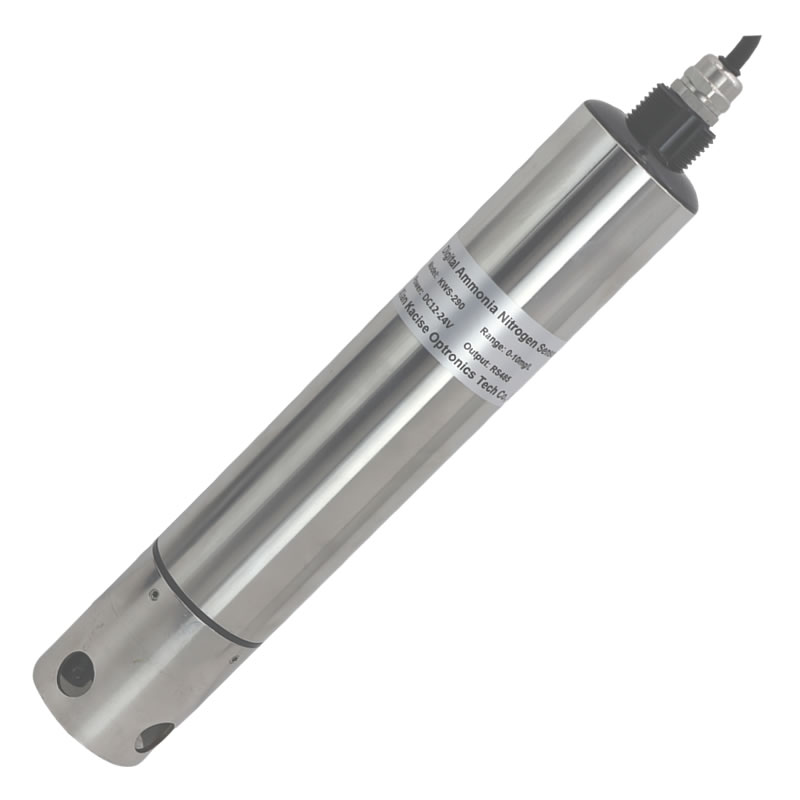
KWS-290 Ammonia Nitrogen Sensor
Digital sensor for NH3-N/NH4+ measurement with IoT support.
Range: 0–100.0 mg/L or 0–1000.0 mg/L.
KWS-1100 Oil-in-Water Sensor
UV fluorescence method for high-precision oil detection.
Detection Limit: 1 ppb.
Conclusion
A data-driven assessment of production capacity and delivery controls is fundamental to de-risking your water quality sensor procurement. By moving beyond basic product specs to evaluate metrics like monthly output, lead time drivers, inventory strategy, and supply chain resilience, industrial buyers can identify partners capable of supporting both immediate project needs and long-term operational stability. The evolving landscape, particularly with capable manufacturers in China, offers a combination of scale, flexibility, and competitive logistics that can be strategically leveraged for a reliable and cost-effective supply chain.
Final Recommendation: Integrate this capacity and delivery evaluation framework into your standard supplier qualification process. Request concrete data and case references, and prioritize suppliers who demonstrate transparent and controlled operations over those who make unsupported claims. This diligence is the cornerstone of a secure and predictable supply chain for critical monitoring equipment.
Have Questions or Need More Details?
Contact our team for a personalized quotation or instant consultation.
Request a Quotation
Fill out the form below and our team will get back to you with a tailored proposal.
WhatsApp Direct Chat
Prefer to chat in real-time? Message us on WhatsApp for instant assistance & quick answers.
- Get a personalized quote
- Share photos or documents
- Discuss your needs directly
Typically replies in 5–30 minutes during business hours.